

Should we rethink the 25% gross-to-net standard?
For years, 25% gross to net has been treated as the gold standard in residential investment. Developers and investors take it as the default, and the figure travels well beyond the UK. Speak to clients in markets as far afield as Australia and the same number holds. It is comfortable, it is comparable, and it slots neatly into an underwriting model. But is a single benchmark still the right way to judge an operating asset that is shaped by its size, location, and amenity offering? We think it is time to look again.
What gross to net actually measures
Gross to net describes the share of gross rental income consumed by operating costs before you reach net operating income. That covers property management, facilities management and maintenance, utilities, insurance, marketing and lettings, voids, and administration. It is worth separating from area net to gross, the building efficiency measure, as the two are often confused. In short, gross to net is the operating efficiency of the running asset, not the design efficiency of the building.
Why 25% became the default
The 25% figure had earned its place. It had represented a workable balance between operational efficiency, resident experience, and investor returns, and it had aligned residential with the asset classes it sat alongside. For institutional investors, it offered a clean, comparable number across a portfolio.
There was also a simpler reason it stuck. UK build to rent operational stock was still relatively young, and there was limited long run performance data to test the assumption against. With fewer mature, stabilised schemes to draw on, models had understandably leaned on legacy assumptions. The benchmark had held, in part, because the real-world evidence needed to challenge it had only recently begun to emerge, reflecting both the infancy of the market and the reluctance of many to share data.
The costs underneath the number are rising
The pressure operators face today looks very different from the environment in which 25% was set. Several operating costs have moved sharply and, importantly, in the same direction.
Insurance has shifted from a marginal line item to a defining one. Building safety and fire remediation obligations carry real and ongoing cost and remain a live consideration for owners across the sector. Energy and utility costs feed directly into operating budgets and weigh most heavily on amenity-rich and communal heavy schemes. Staffing for on-site teams, concierge, and facilities management reflects wider wage inflation. Add the growing focus on service charge transparency, and the running cost base of a modern scheme is materially higher than legacy models assume.
Why gross to net should be scheme specific
Here is the point most often missed. Many of these costs are a fixed minimum rather than a proportion of income. A scheme needs a baseline of management, safety, and facilities provision regardless of how many units it has or what rent it commands. That baseline cannot be spread as thinly across a smaller scheme, or one with lower per-unit rents, as it can across a larger one. The result is that gross to net is driven by the characteristics of the individual asset, not by an industry-wide rule.
The variables that move the number include unit count and economies of scale, amenity level, location and local wage costs, single versus multi-building configuration, any affordable or mixed tenure element, asset age, the management model, and the degree of technology adoption. No two schemes carry the same combination, so no single figure fits them all.
What our data shows
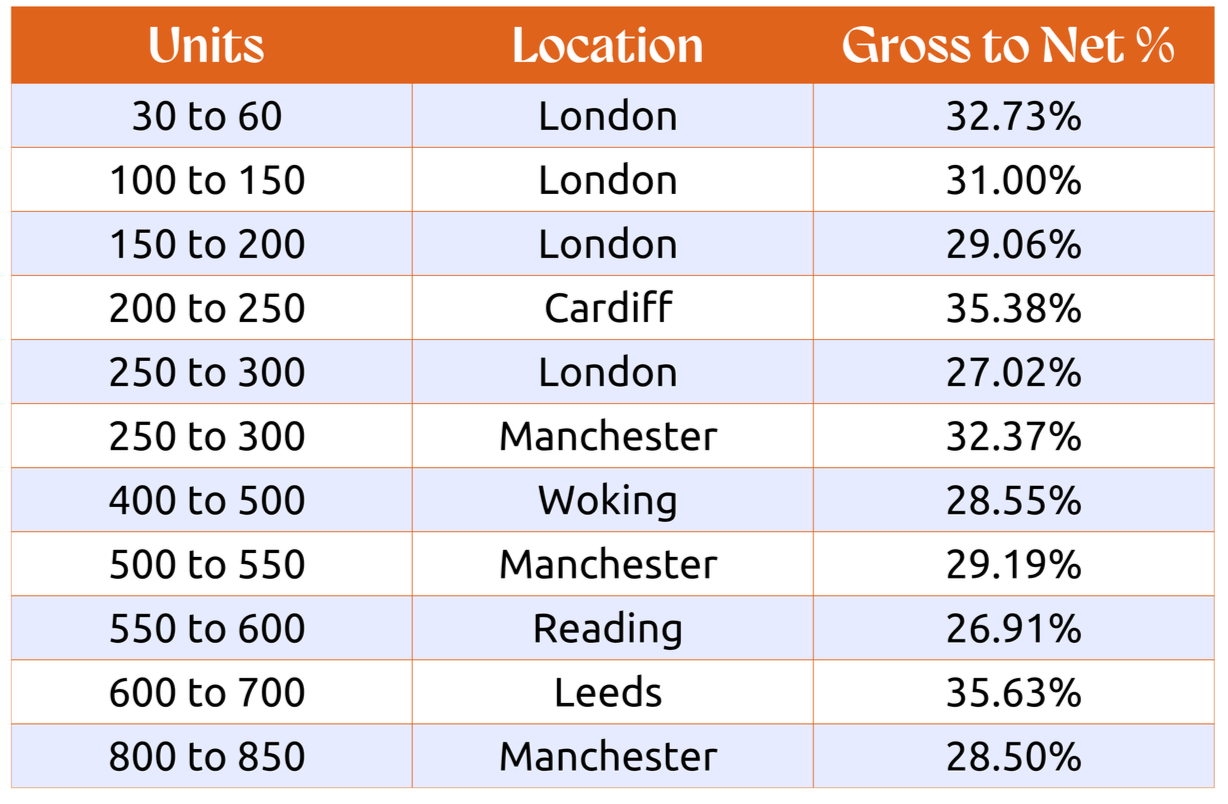
Our experience across live, operational schemes tells a consistent story. Across eleven medium to high amenity schemes, gross to net averages around 30.6%, with a median of roughly 29.2% and a range from 26.91% to 35.63%. Not one sits below 27%.
Scale alone does not decide the outcome. The 800 to 850 unit Manchester scheme runs at 28.50%, yet the 600 to 700 unit Leeds scheme reaches 35.63%, and the 200 to 250 unit Cardiff scheme 35.38%. If size were the whole story, the largest schemes would always be the most efficient. They are not, which is precisely the case for assessing each scheme on its own terms.
External data points in the same way. Recent figures from a global property index capturing the performance of more than 80 portfolios, place gross to net for multifamily assets at approximately 38%, moderating to around 28% across the residential sector as a whole. Independent market benchmarks such as the IPD Residential Index have also referenced figures of around 32%. Three separate datasets, all comfortably above the historic 25% mark.
What this means for you
For investors, the opportunity is in underwriting the reality of the specific scheme. A target grounded in the asset's own characteristics protects returns and avoids an uncomfortable gap at stabilisation.
For developers, the operating cost base is set at the design stage, years before the first resident moves in. Amenity mix, unit count, and layout efficiency are operating decisions as much as design ones. Bringing an operator into the conversation early is where value is protected.
For operators, there is a strong case for being measured against a fair, scheme appropriate target rather than a blanket figure that was never built for the asset in front of them.
The sector is already opening up this conversation. The next step is to ground it in real operational evidence rather than legacy assumption. That is exactly the work we do every day.
If you would like support in understanding how your operational model stacks up in today's market, we would be glad to talk it through. Get in touch with the SAY team.